
Part 1 of 3: We’re In One Now – They Don’t End Well
When the Junk Drawer Outperforms
We all have that drawer in the kitchen filled with expired coupons, dead batteries, and mystery keys. Imagine if those contents suddenly appreciated far faster than our fine silverware.
Since July 2025, we’ve watched a version of this pattern unfold in markets. The Russell 2000 surged 12.4% in Q3 versus the S&P 500’s 8.1% – small-cap stocks with historically weaker balance sheets and lower profit margins outpacing established quality companies by over 50%.
From April’s market low through September, the divergence became even more pronounced. Small-caps rallied 39.9% while large-caps gained 35.2%. The smallest companies – the Russell Microcap index – exploded 53.8% over the same period.
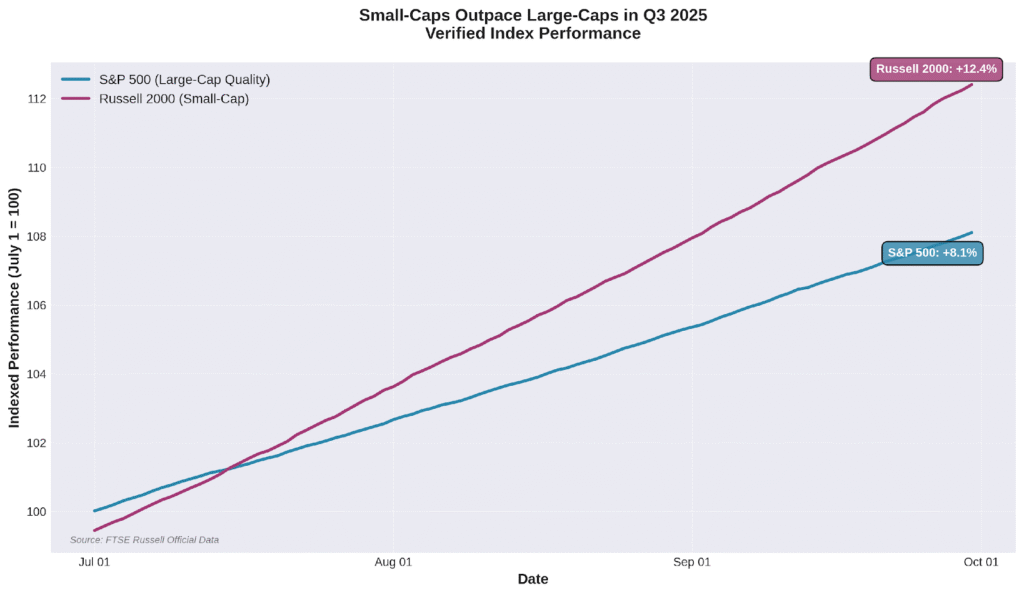
Chart 1: Small-cap stocks (Russell 2000) outpaced large-caps (S&P 500) by 4.3 percentage points in Q3 2025. Source: FTSE Russell Official Data.
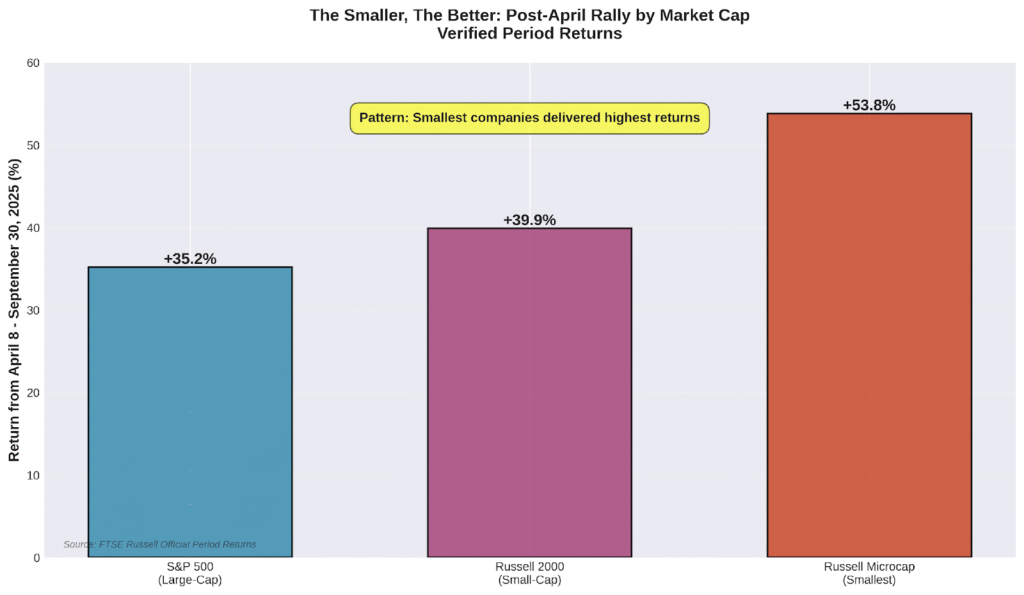
Chart 2: From April low through September, the smallest companies delivered the highest returns. Source: FTSE Russell Official Period Returns.
The Quality Disconnect
Meanwhile, quality stocks – companies with strong balance sheets, consistent profitability, and sustainable competitive advantages – have dramatically underperformed. The Morningstar Quality Factor Index, which tracks these characteristics, ranked among the worst-performing factor strategies in early 2025, and that pattern has continued through the year.
This represents a fundamental shift from 2023-2024, when quality stocks commanded premium valuations driven by AI enthusiasm and flight-to-safety positioning. Now, investors are rotating away from these defensive characteristics toward more speculative opportunities.
Instead of the typical flight to quality we anticipated after April’s tariff-related market disruption, investors embraced risk. The companies with the weakest fundamentals delivered the strongest returns.
Historical Context: When Have We Seen This Before?
This pattern isn’t new. It tends to appear during specific market conditions:
Late 1999 – Early 2000: During the final stages of the dotcom bubble, unprofitable internet companies with zero revenue massively outperformed established technology leaders. Companies like Pets.com and Webvan commanded billion-dollar valuations despite never achieving profitability. The pattern ended with the 2000-2002 crash that erased 78% from the NASDAQ.
2007 (Pre-Financial Crisis): Speculative stocks in financials, homebuilders, and mortgage-related sectors significantly outperformed quality companies. Investors dismissed risk warnings, assuming housing never goes down. The pattern reversed catastrophically in 2008.
Early 2021: Meme stock mania saw retail investors coordinate through social media to drive up shares of struggling companies like GameStop and AMC Entertainment. These stocks gained hundreds of percent within weeks based purely on momentum and social sentiment, not fundamentals. Many investors who bought at the peak suffered significant losses when enthusiasm waned.
Common Thread: In each case, investor focus shifted from cash flows and earnings to narratives, momentum, and speculation. Quality underperformance preceded market corrections – though the timing varied from months to over a year.
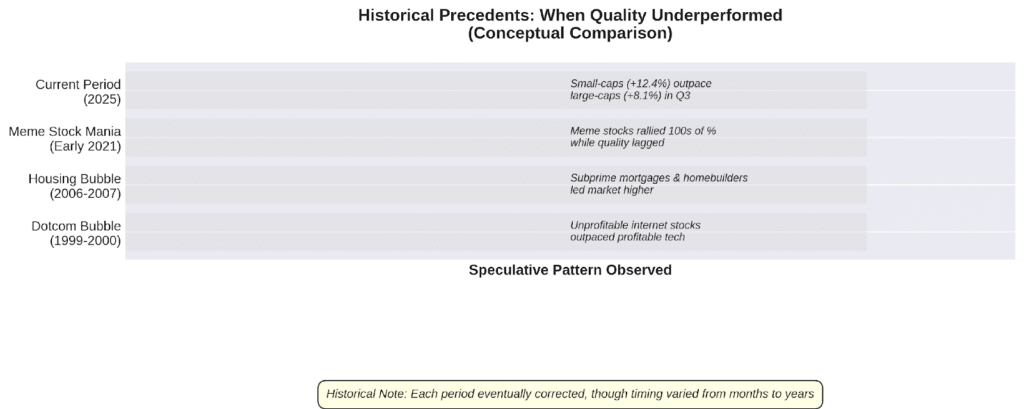
Chart 3: Historical precedents show quality underperformance has appeared before major market corrections, though timing varied significantly.
Why This Matters to Every Investor
We might reason, I don’t own these speculative stocks, so this doesn’t affect me. That’s only partially true.
When risk assessment breaks down and money floods into speculation, we’re often – though not always – in the later stages of a bull market. These periods can last months or even years, making precise timing impossible.
It’s also a very challenging period for disciplined investors. When lower-quality companies deliver substantially higher returns, it forces constant questioning: Am I being too conservative? Am I missing something?
This psychological pressure can lead even experienced investors to abandon their principles. The pattern typically ends with a peak where the subsequent correction ranges from moderate (10-15% decline) to severe (50%+ decline like 2000-2002).
Pattern Recognition
Based on historical analysis, here are the markers we monitor:
- Late Cycle Dynamics: After bull markets run for years, investors increasingly reach for missed opportunities by chasing more questionable investments.
- Liquidity Effects: Excess money shifts progressively from quality stocks to growth stocks, and finally to pure speculation.
- FOMO (Fear of Missing Out): Watching others make quick money creates intense psychological pressure to join.
- Narrative Dominance: Every speculative period has compelling stories that provide intellectual justification for what may ultimately prove unsustainable.
- Quality Discount: When high-quality companies trade at significant discounts to lower-quality peers on a risk-adjusted basis, market pricing may be distorted.
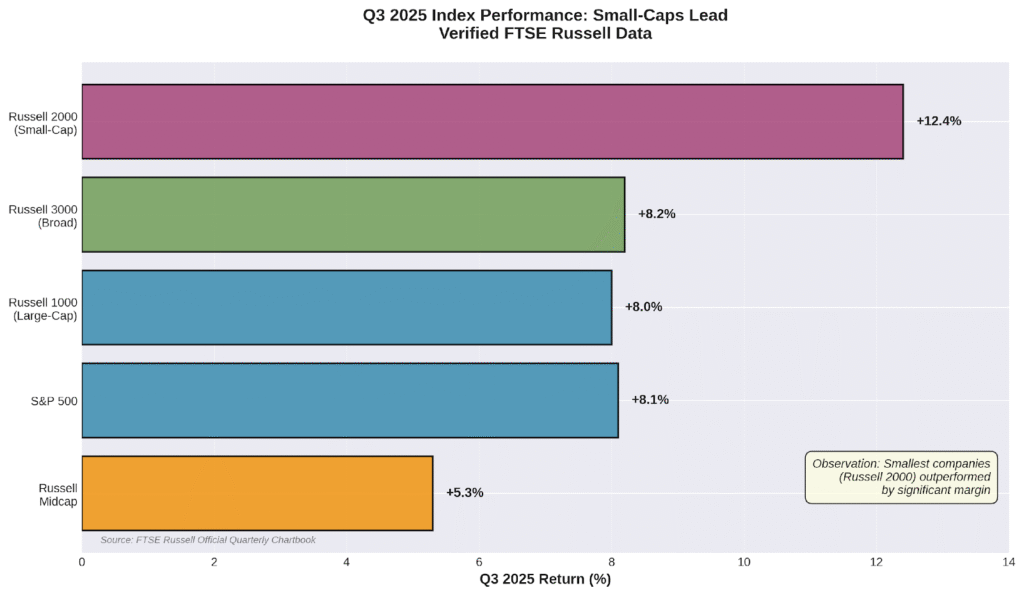
Chart 4: Q3 2025 performance across the index family shows consistent pattern – smaller companies outperformed. Source: FTSE Russell Official Quarterly Chartbook.
The Challenge of Market Timing
We cannot predict exactly when a trash rally will end. The current small-cap outperformance and quality underperformance may continue for many months or even years. Meanwhile, we will draft this rally like a race car, holding quality stocks we believe can perform well in this environment.
Coming Up in Part 2
Our next article examines the history of speculative bubbles in detail.
IMPORTANT DISCLOSURES
This article is for educational purposes only and does not constitute investment advice. Past performance does not guarantee future results. All investing involves risk, including potential loss of principal.